
The Patient Pathway Analysis (PPA) methodology describes the alignment between patient care-seeking and TB service availability. The results can inform programmatic priority setting and planning for more patient-centered availability of services.
The aim of this sub-section is to inform the alignment between the availability of TB diagnostic and treatment services at facilities and care-seeking behavior towards these facilities using Patient Pathway Analysis
The PPA wizard is a free online tool developed by Linksbridge for conducting a PPA in a simple and user-friendly format, and provides automated visualization and analysis based on the data uploaded.
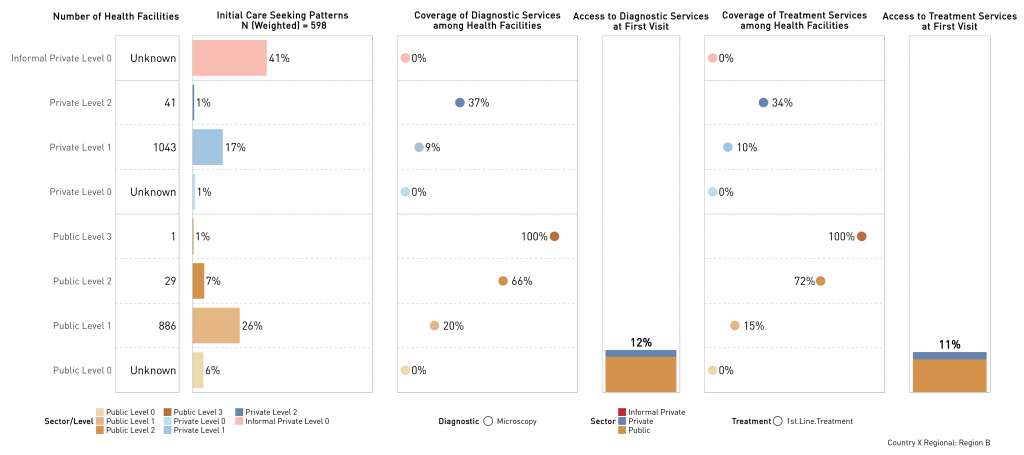
The output of the PPA displays five core metrics to determine whether public health programs and service availability align with patient care-seeking preferences:
- Place of Initial Care Seeking: Proportion of patients that initiate their care-seeking journey at each sector and level of the health system.
- Diagnostic Coverage: Proportion of health facilities with a given TB diagnostic service, by facility level and sector (informal, public, private).
- Access to Diagnosis: Estimated proportion of care seekers that access diagnostic services on their first visit.
- Treatment Coverage: Proportion of health facilities that have anti TB medicines in stock and that can supervise patients during the treatment initiation or continuation phases.
- Access to Treatment at Initial Care Seeking: Estimated proportion of care seekers that access facilities with TB treatment services on their first visit.

1. Get familiar with the PPA process
A comprehensive step-by-step guide on how to conduct a PPA can be found in the PCF learning Management System (LMS), see the e-Learning section for more details. The videos below provide an introduction and overview.
2. Collate the data
The essential data sources for each metric are shown below. However, a complete overview of data sources per PPA metric can be found in the patient pathway guide.
|
Metric |
Data Source |
|
Number of health care facilities (per level of care and sector) |
Health Facility Master List (HFML) national or subnational level |
|
Place of initial care seeking for TB like symptoms |
TB Prevalence Survey (TB PS) Service Availability and Readiness Assessment (SARA) Demographic and Health Survey (DHS) Health Expenditure and Utilization Survey (HEUS) |
|
TB service availability per facility |
National TB Lab Database Service Availability and Readiness Assessment (SARA) Service Provision Assessments (SPA) |
If the Demographic Health Survey (DHS) data will be used, ensure registration with the DHS is done one month (at a minimum) before the process starts. This request can be submitted here: The DHS Program – Data.
3. Clean the data
Data from the different data sources should be cleaned to ensure data is quality. This is the process of finding and correcting untrustworthy, erroneous, or outdated information from a database It aids in the detection of data that is missing, wrong, inaccurate, or irrelevant. Data cleaning can be done by monitoring errors, validating data accuracy, scrubbing for duplicate data, conducting quick analysis on the data, and communication with the team.
The quality of the data also impacts successful data upload into the PPA wizard and the quality of the PPA outputs (results). Data cleaning can be done using any statistical software package, e.g., MS Excel or STATA, the PPA.
4. Upload cleaned data into the PPA Wizard
The PPA Wizard How-to-Guide (click button above) provides a step-by-step guide on how to register on the website, upload data (with a description of the different data types and formats required), and finally generate the PPA results. High-level overview of the steps include:
Select PPA Metrics: number of health facilities and place of initial care seeking are pre-defined, TB service capacities can be added and defined as desired (up to 4 different diagnostic and treatment services)
Provide Data: Upload the data source per PPA metric, one source can be used multiple times
Identify Variables: Select the columns containing values for facility type, health sector, and health service for each dataset. Select columns containing geographies if you’re doing a subnational PPA.
Map Facilities: Assign level and ownership to each facility. Ensure the variables are named to match the respective datasets as this makes the process more efficient.
Map Geographies: Assign geography (or hierarchy) to the facilities (where available).
Create Output: Clicking this button creates the output files including the data sets and the visuals referred to as the PPA results.
5. Interpret the PPA Wizard output
This step involves the discussion of the results. To guide the discussions,
- Identify gaps between care-seeking and health facilities at each level
- Identify gaps between care-seeking and diagnostic services
- Identify gaps between care-seeking and access to diagnostic services
- Identify gaps between care-seeking and treatment services
Example of a PPA Result (output) generated by the PPA Wizard
6. Conduct sensitivity analysis
A sensitivity analysis determines how different values of an independent variable affect a dependent variable under a given set of assumptions. For this process, conduct a sensitivity analysis using different datasets, while acknowledging the limitations of each dataset such as the target group, year conducted, etc. Based on risk groups in the country (e.g., smokers, low socio-economic status (SES), men, elderly), conduct stratified analysis for each group.
|
Metric |
Data Source |
Requirements |
Comments |
|
Number of health care facilities (per level of care and sector) |
Health Facility Master List (HFML) |
Assign a level of care and sector to each facility. This should be done by the country team as they understand the health system structure. Maximum of 2 characterizing variables per facility e.g., create a variable in the dataset where you can set a Facility as ‘Private’ (ownership) and ‘Level 1’ (Level) Only a maximum of 10 types of level-ownership combinations can be entered into the wizard – e.g., combination possible between Level 1-6 and ownership selection of Public, Private, or custom |
If there are more than 10 different level-ownership combinations, discuss with the experts in the country, how levels can best be merged The report should include a description of the level-ownership combinations, this will highlight if the merging may have biased the results |
|
Place of initial care-seeking |
Service Availability and Readiness Assessment (SARA), Demographic and Health Surveys (DHS), TB Prevalence surveys, Households and the Environment Survey (HEUS) |
Categorical variable with place of initial care-seeking for TB like symptoms Can be mapped to the levels/ ownership of facilities in the PPA Wizard Ideally the variable should be recoded into levels and ownerships in the dataset to avoid mistakes while entering the data in the wizard – e.g., create a variable in the dataset where you can set a Facility as ‘Private’ (ownership) and ‘Level 1’ (Level) |
Use the most recent TB-specific data available in country Place of initial care seeking for TB may not be available in a data source, option is to find alternative e.g. care seeking for TB symptoms OR initial care seeking for child with fever Care seeking in children as reported in DHS should be used with caution as a proxy for adult care seeking for TB symptoms [1]. For people that sought care at more than one facility either exclude these patients or make an assumption that the highest/ lowest level facility was the first place care was sought – all assumptions should be clearly stated in the report. |
|
TB service availability per facility |
National TB Lab Database, Service Availability and Readiness Assessment (SARA), Service Provision Assessment (SPA) |
Binary variable indicating service is available |
Some facilities may have sample transportation systems available. Discuss with the NTP if the sample transportation can be used as a proxy for diagnostic services. Consider creating a version with sample transportation included in diagnostics capacity and one without. Some facilities may only provide service level treatment initiation, or treatment continuation services or both services. Ensure the services provided are clearly described and referenced when interpreting the results |
Last Update: Tuesday, January 3, 2023