
How is data organized?
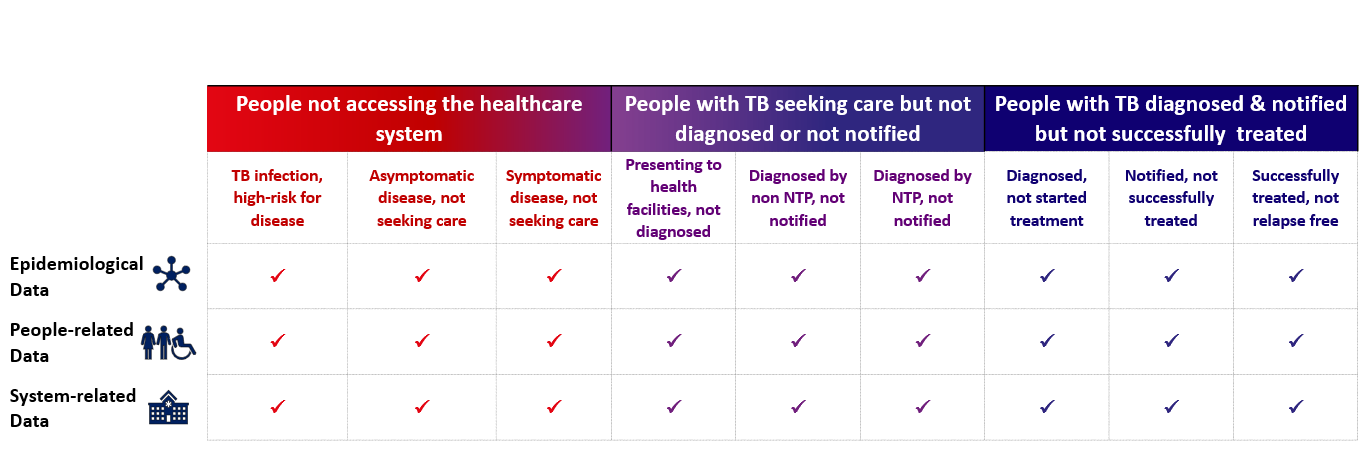
Data is organized in three main categories as shown in the figure below (more details in the PCF dashboard in the tool kit section). Refer to list of PCF DHIS2 Dashboard Indicators.
Country TB Profile
This section describes an overview of the TB profile in the country.
TB Care Continuum 1: People not accessing the health system
This section describes the epidemiological evidence and includes data about people not accessing the health system and therefore not entering the care continuum.
TB Care Continuum 2: People with TB seeking care but nor diagnosed or notified
This section describes the risk profiles (e.g. age, sex, socioeconomic status, HIV status), knowledge, perceptions, expectations, and behavior of people with TB or at risk of developing TB. The risk profile data is as relevant to whether the patients access the health system at all (as in TB Care Continuum 1) as it does for people with TB seeking care but are either not diagnosed or not notified.
TB Care Continuum 3: People notified as a TB patient but not successfully treated
This section describes the evidence on in-country systems and includes the capacity, performance, limitations, and distribution of health and social services, both TB-specific and general, which may be associated with TB treatment outcomes.
Last Update: Friday, December 30, 2022