
Examples of data mapping & visualisation
Tip
Data Consolidation teams can use customised dashboards compatible with the country HMIS or use predefined templates provided in the toolkit section. These customised dashboards can be as simple as MS Excel spreadsheets with linked to manual visualisations ot more complex database entry formats linked to automated visualisations. (Blueprints and further guidance will be released as part of future developments).
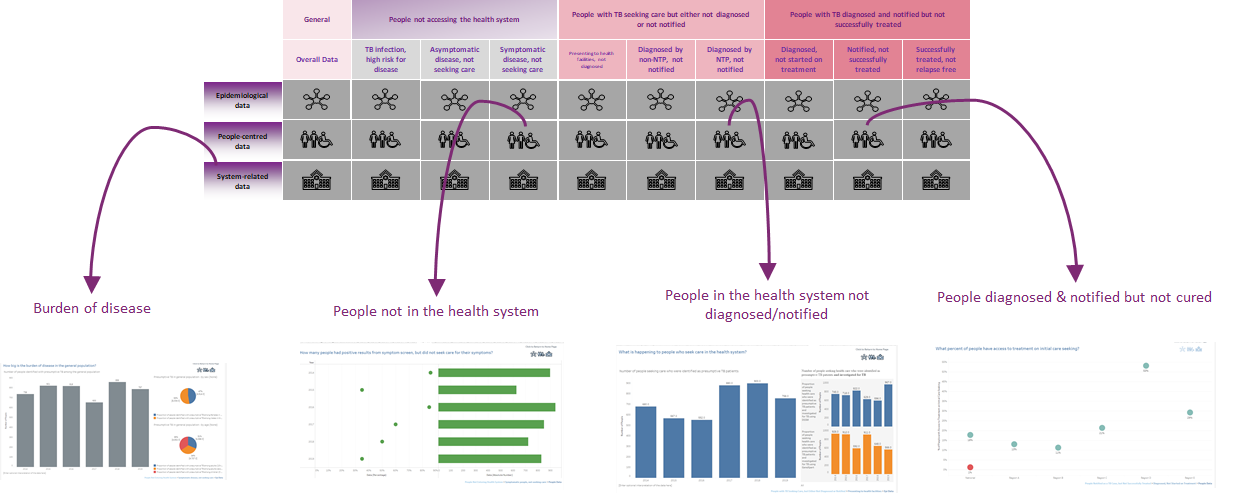
1: Mapping using pre-defined MS Power Point and MS Excel templates

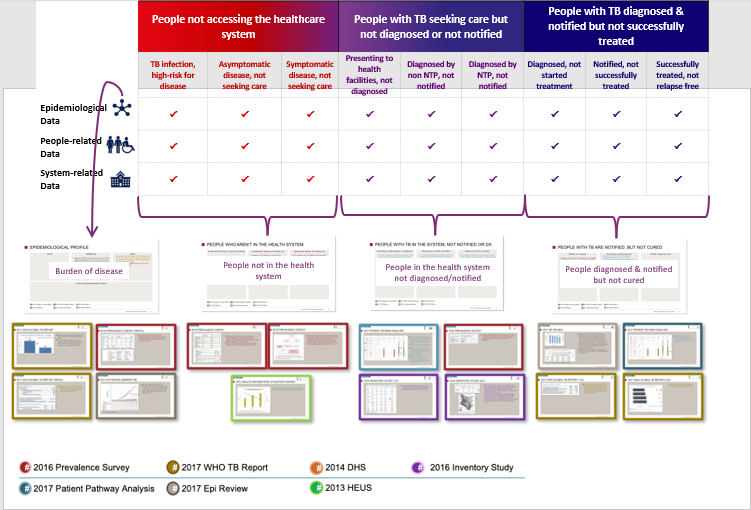

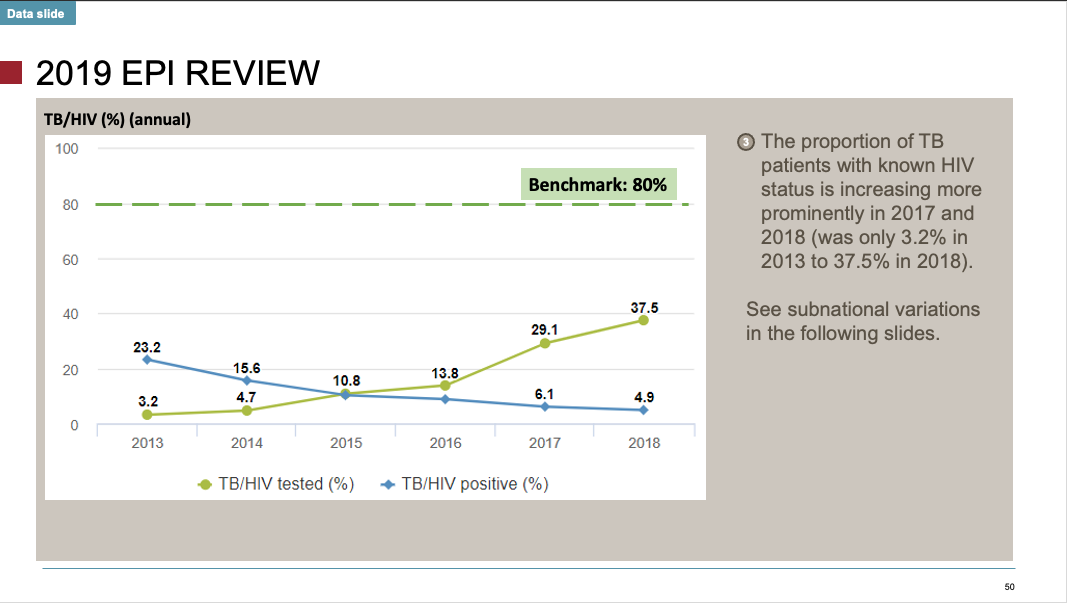
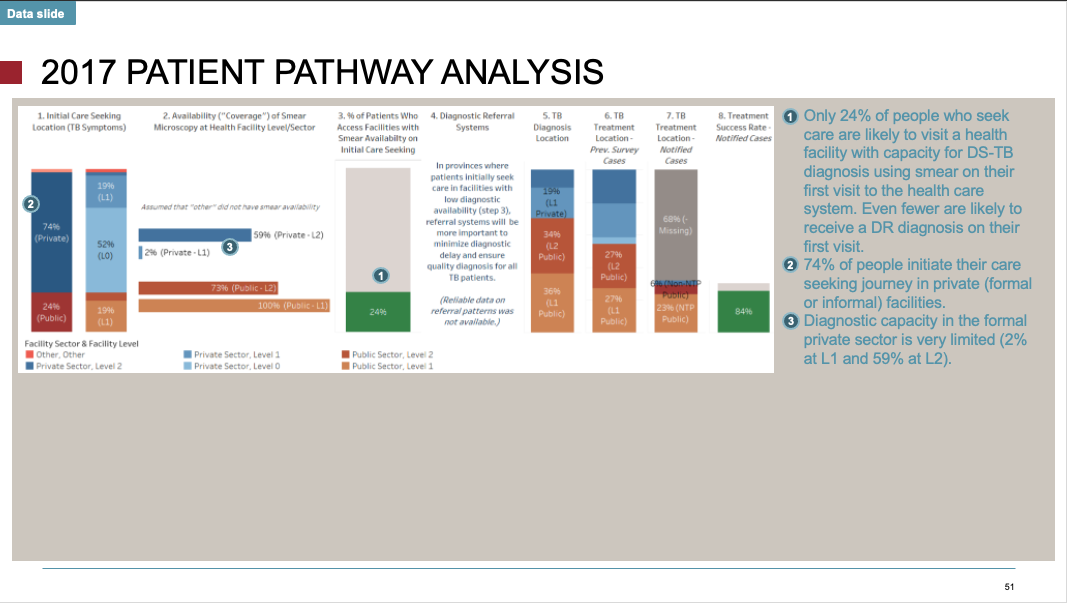
2: Data consolidation, visualisation & interpretation slides
3: Mapping & visualisation using a dashboard
Tip
Data Consolidation teams can the DHIS2 PCF Dashboard (developed to support the data consolidation process)


Last Update: Tuesday, January 3, 2023
Total 0 Votes:
0
0